
Integration, Diversity and Brexit Light
This is the light version of the article, if you want to read the technical version click here
Summary
There has been a lot of coverage about Brexit and why the UK voted out. A large part of the discussion was along the lines of the uneducated poor vs the metropolitan elites. We take a different approach looking at whether communities where the White-British and non-White British (Asian, Polish, etc) populations are highly integrated tended to increase or decrease the likelihood of voting out. At the extreme ends 10 out of 10 of the most segregated local authority districts voted Out whilst 8 of the 10 most integrated voted In. In fact, our statistical models show, more diversity and integration reduces the probability of voting out. These findings hold true even when we control for deprivation, what’s more we find that the most and least deprived areas were more likely to vote In and it was the local authorities in the middle of the deprivation scale that were more likely to vote Out, challenging the poor vs elite argument. Given these results we conclude that segregation is a serious issue for the UK that can create mistrust between communities.
What are we trying to do?
“What we want to know is “What are the most and least segregated parts of the UK? and how did that, if at all, affect voting for Brexit?”
This year Brexit has been the only topic in British politics. Like it or not the UK voted by a slim margin to leave the European Union and go it alone. The run up the Brexit campaign was, to put it mildly emotionally charged and arguably the campaign to leave was underpinned by concerns about immigration. These concerns covered illegal immigrants from Sub-Saharan Africa and the Middle East, as well as legal immigrants from the EU. At about the same time Academics Ted Cantle and Eric Kaufmann found that segregation was increasing between White British citizens and the other ethnic groups resident in the UK. After the referendum a lot of analysis suggested that older and poorer voters predominantly voted for Brexit. Given the tone of the referendum campaign it seems surprising that ethnicity and peoples relation to it wouldn't be some driver of voting patterns. On the other side of the Atlantic Nate Silver analysed ethnic segregation in the US and found that“The Most Diverse Cities Are Often The Most Segregated”. Obviously the US has a very different ethnic history than the UK but still the findings are surprising and could be interesting in the UK context.
So basically, Segregation in the UK is increasing; the UK (or more accurately England), has voted for Brexit; In the US diverse cities can also be highly segregated. All those bits are very interesting but how do they tie together? What we want to know is "What are the most and least segregated parts of the UK? and how did that, if at all, affect voting for Brexit?".
What did we find?
Using data from the 2011 census we created a diversity score and an integration score and used this to rank/index all the local authorities in England, Wales and Scotland (For more info on this see the technical version of the article) . Mapping the Integration Index below, showed some very clear patterns, specifically that the North West of England is, relatively speaking, a hub of segregation. Due to it's size to population density London is broken out into a separate graphic, almost all of the city is above the line for integration with the exception of three boroughs Redbridge, Hounslow and Croydon. The most integrated boroughs in London are Kensington and Chelsea, Islington and Camden.

The more blue an area the more integrated it is the more red the more segregated. As can be seen the North West around Manchester is one of the most segregated areas of the country. The Midlands near Birmingham is also more segregated than would be expected.
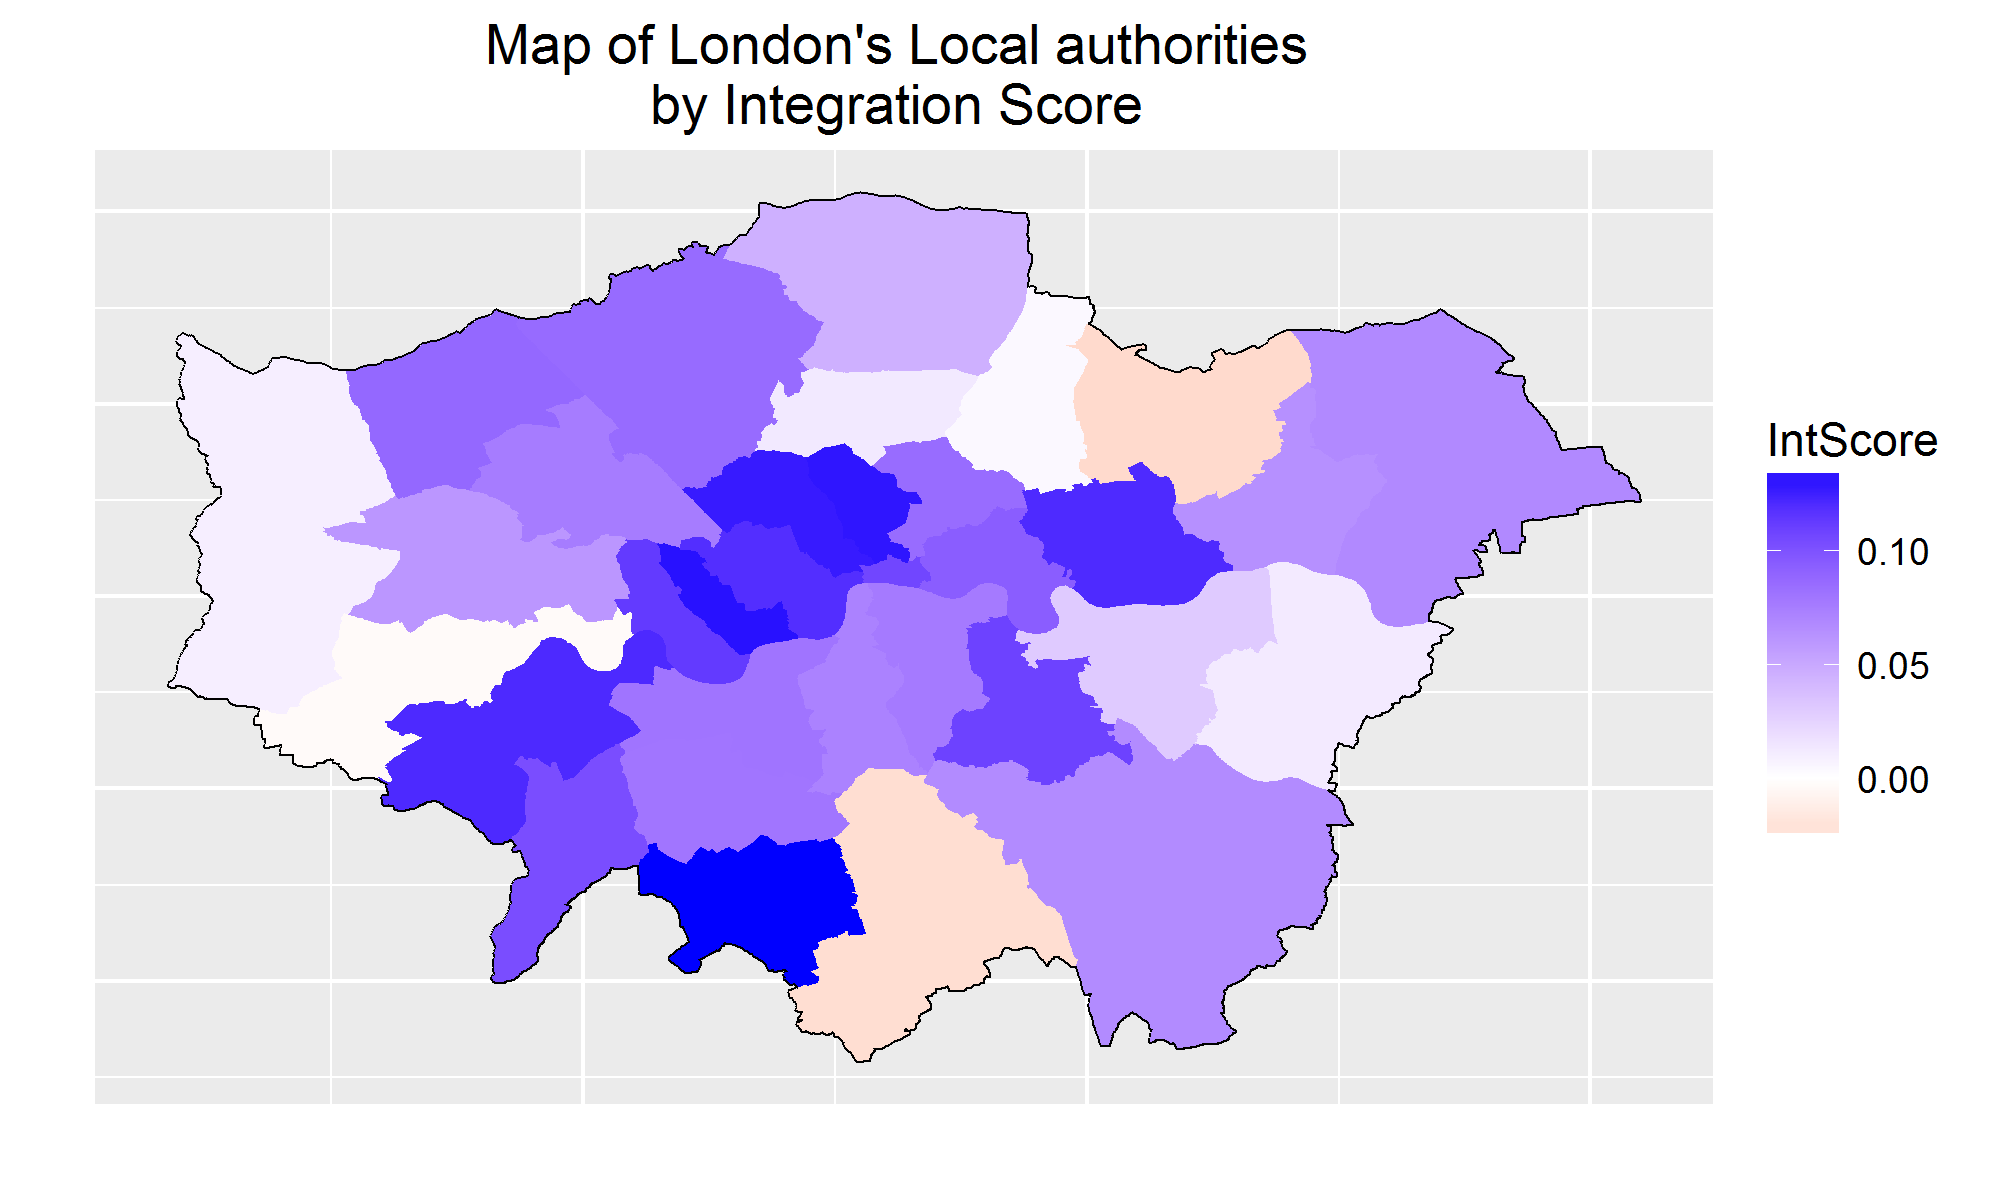
London Boroughs are generally more integrated than expected, however Redbridge, Hounslow and Croydon, are more segregated.
“Some of the most integrated places in the UK are Oxford and Cambridge, arguably because of the high international student population.”
The plot below shows the relationship between local and regional diversity, dots below the red line are less integrated than expected (Burnley, Oldham Blackburn) whilst the dots above the red line are more integrated than expected (Oxford London, Manchester). Although Manchester, is more integrated than average, the post industrial towns that lie nearby are the most segregated areas of the country, Burnley, Oldham, Blackburn and Bradford (near Leeds) sit a long way below the expected average line (shown in red) for cities of their level of diversity. A Smaller area of segregation is the Midlands with Birmingham, the UK's second largest city, being significantly more segregated than would be expected for a city that diverse. Some of the most integrated places in the UK are Oxford and Cambridge, arguably because of the high international student population which is relatively evenly dispersed and not separated from the White British student population. This may have also helped Bristol and Cardiff two other large cities keep above the line in terms of integration, as they also have substantial student populations relative to their size, however the analysis doesn't explicitly pinpoint such reasons.

Above the red line means more integrated than expected, below the red line means less integrated than expected.
Diversity Integration and Brexit
So far we have seen that there are reasonably large differences in how integrated or otherwise different parts of the country are even after accounting for different levels of diversity. In some areas, such as Burnley and Oldham, the levels of segregation are quite high which is what Cantle and Kaufmann discuss. We have also seen that although certain areas have high levels of diversity, Such as Birmingham and Bradford, they may be actually quite highly segregated, this is what Silver discusses. However we have not yet explored how this has any meaning in peoples everyday lives.
“Of the top 10 most Segregated areas 100% voted out, whilst for the top 10 most integrated areas 80% voted in.”
The tables below show the top ten most segregated and most integrated parts of England and Wales. There is a clear distinction between them in terms of voting In or Out on Brexit. Of the top 10 most Segregated areas 100% voted out, whilst for the top 10 most integrated areas 80% voted in. In order to explore how diversity and integration had interacted with Brexit we built some statistical models, these models found that areas are more likely to vote in if they have a higher diversity score and also if the ethnic minorities are better integrated with the White British population.
“Although 7 of the 10 most deprived areas voted Out and 8 of the 10 least deprived voted In, closer analysis reveals a more nuanced relationship between views on Brexit and poverty”
As one of the commonly mentioned drivers for Brexit was poorer people we included a measure called the multiple indices of deprivation. Using this we found that 7 out of 10 of the most deprived areas voted for Brexit suggesting that this theory could be true. However when we combined the data in a statistical model we saw that actually the most deprived and least deprived were more likely to vote in and those in the middle more likely to vote out, providing a more nuanced message than that which was commonly put out. The model which included diversity, integration and deprivation was the most accurate of the models we built predicting 83% of cases correctly.
| Region | LAD | Int Score | Brexit | |
| 1 | North West | Blackburn | -0.44 | Out |
| 2 | North West | Oldham | -0.44 | Out |
| 3 | Yorkshire and The Humber | Bradford | -0.41 | Out |
| 4 | North West | Burnley | -0.35 | Out |
| 5 | North West | Pendle | -0.34 | Out |
| 6 | Yorkshire and The Humber | Calderdale | -0.32 | Out |
| 7 | North West | Hyndburn | -0.31 | Out |
| 8 | Yorkshire and The Humber | Kirklees | -0.3 | Out |
| 9 | North West | Rochdale | -0.28 | Out |
| 10 | North West | Bolton | -0.25 | Out |
| Region | LAD | Int Score | Brexit | |
| 1 | South West | Isles of Scilly | 0.14 | In |
| 2 | London | Sutton | 0.14 | Out |
| 3 | East of England | Cambridge | 0.13 | In |
| 4 | South East | Oxford | 0.13 | In |
| 5 | London | Camden | 0.13 | In |
| 6 | London | Islington | 0.13 | In |
| 7 | London | Kensington and Chelsea | 0.13 | In |
| 8 | East of England | Hertsmere | 0.12 | Out |
| 9 | London | Newham | 0.12 | In |
| 10 | London | Richmond upon Thames | 0.12 | In |
Conclusions
“Higher levels of integration and higher levels of diversity seem to provide a more positive view of the EU than the other way round”
In this article we have considered how ethnic integration segregation is distributed across Scotland, England and Wales and explored possible ways in which that segregation may affect the society we live in. We have seen that the most segregated areas of the England and Wales are in the North-West of the country. We have also seen that there is a link between voting preferences in the Brexit referendum and levels of diversity and segregation, even when controlling for deprivation. To be specific, higher levels of integration and higher levels of diversity seem to provide a more positive view of the EU than the other way round. Despite these results we should be cautious as correlation does not imply causation, segregation and opinions of the EU could both be symptoms of some other factor.
““The link between segregation and voting is significant and seems intuitive. If two ethnic groups exist in the same area but have little interaction it is unsurprising that there is mistrust””
Bearing in mind the caution on causality, the link between segregation and voting is significant and seems intuitive. If two ethnic groups exist in the same area but have little interaction it is unsurprising that there is mistrust, especially if one of those groups isn't "native". It is harder to mistrust those who you have regular social interactions with such as neighbours, work colleagues or the parents of your children's friends. This mistrust between communities is known in social psychology as Ingroups and outgroups. It seems only natural that in the febrile atmosphere of the Brexit campaign, areas that already had high levels of segregation would be more inclined to vote out.
Given this link between ethnic integration and a very real societal reaction to it, it seems sensible that the causes of segregation, how it is reduced and how it is maintained are explored further both by researchers and policy makers, in order to improve integration and trust between all communities in our country.
Not detailed enough?
If you think you want more detailed analysis or want more information on the methods used click here for the technical version of this article.
